Distressed Debt Levels Are Very Disconnected from Default Activity – That’s a First
-
April 04, 2024
Downloads Download Article
-

The prevailing narrative in leveraged credit markets so far this year goes something like this: A recession has been averted, quantitative tightening (“QT”) policies didn’t crash the economy, and the Fed is landing the plane. Capital is plentiful, yields are still attractive for lenders and credit markets are wide open, so there’s money available for all but the most desperate borrowers. The worst impact of tight money policies on the leveraged corporate sector is behind us, interest rates are poised to fall and restructuring activity is subsiding and will continue to do so. A persuasive bit of evidence cited in this narrative is falling levels of distressed debt, which would signal credit markets’ optimism about business conditions ahead for the leveraged corporate sector. To all of this we say: Not so fast.
Distressed debt is not a universally defined term but is widely understood to be a corporate debt security or instrument whose market yield (lower of yield-to-maturity or yield-to-worst) exceeds the yield on a comparable Treasury security by more than 1000 basis points (bps). The distressed debt ratio is the percentage of all corporate speculative-grade securities with market yields that are considered distressed. The distress ratio changes daily as market prices and yields change, but generally it is reported monthly by the rating agencies and other credit-related publications. Its long-term average since 1990 is approximately 12% per S&P, but it can vary significantly from that average during periods of high market stress or calm, notably with huge spikes during crisis moments. Currently the U.S. distressed debt ratio hovers around 6.0%, its lowest level since QT went aggressive in mid-2022 and about one-half of its long-term average.
Market pundits have long believed that the distressed debt ratio is an indicator of future default activity because markets anticipate notable changes in default trends several months before they materialize. Logically this makes sense, because markets can react to significant events immediately while the resultant impact from those events in the form of corporate debt defaults can take months to occur. For instance, the distress ratio shot higher in March 2020 when the parabolic spread of the COVID-19 virus caused many states to impose near-lockdown conditions, but the impact of stay-at-home living conditions on corporate performance and default events didn’t fully manifest until a few months later. This time lag effect between the distress ratio and ensuing default activity is especially evident around shock events when credit market movements are sudden and dramatic, such as during the COVID-19 pandemic and the September 2008 global financial crisis (Figure 1) when the distress ratio surged before the debt defaults and bankruptcies piled up.
However, other than instances of credit market reactions to extreme events, the distress ratio tends to move in tandem with corporate defaults without an obvious lead–lag relationship (Figure 1). In other words, during relatively normal times it is not plainly evident whether the distress ratio anticipates default activity or reacts to default activity, since their movements correspond very closely.
Figure 1: U.S. Corporate Debt Defaults vs. Distress Ratio
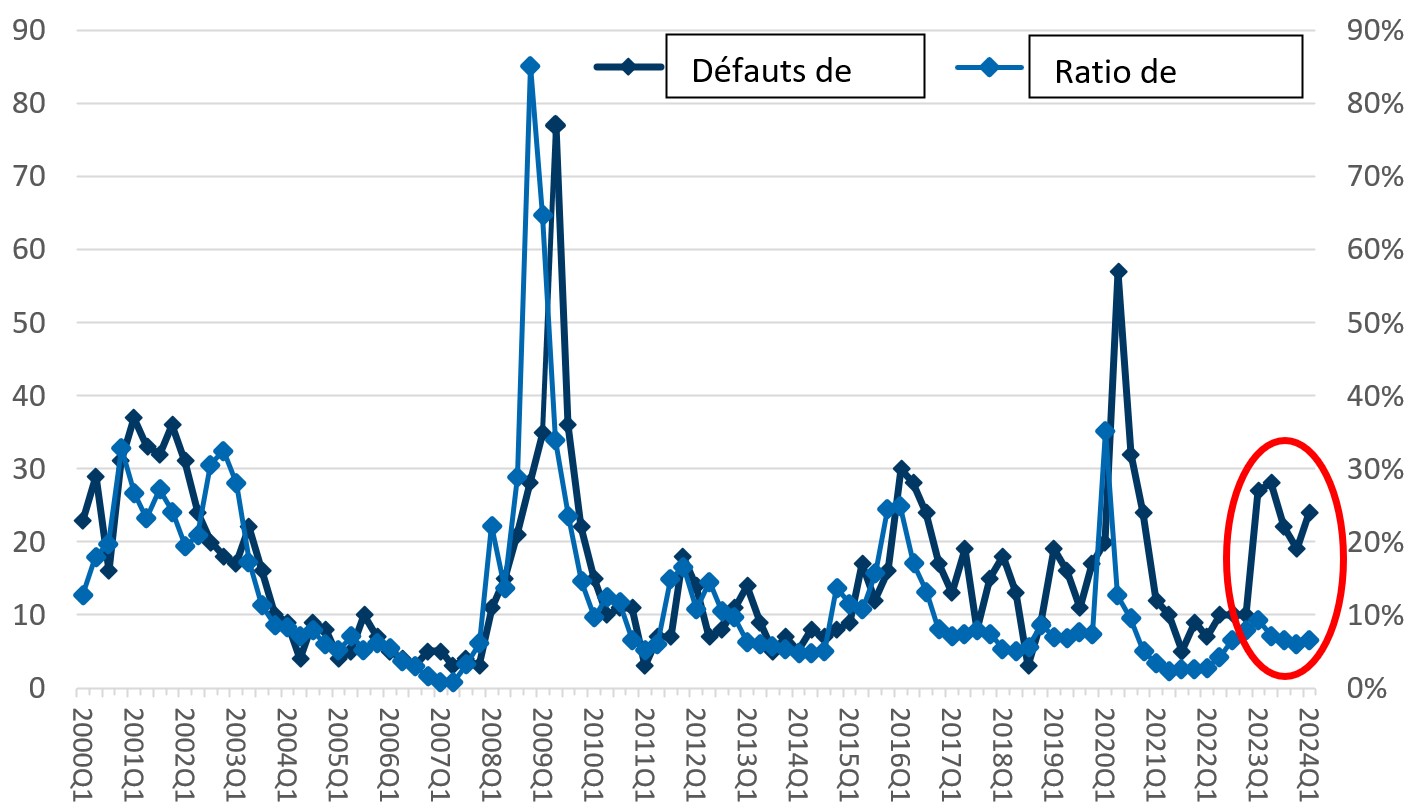
Source: S&P Global Ratings Credit Research
By all accounts and measures, the volume of distressed debt has tanked since mid-2023, with Bloomberg reporting 284 distressed corporate bonds (146 issuers) trading at the end of March compared to 345 issues (194 issuers) at the end of September and 444 issues (253 issuers) one year ago.1 S&P reported $61 billion of rated U.S. distressed debt (105 issuers) at the end of February compared to $106 billion (183 issuers) at the end of March 2023. Clearly, leveraged credit markets have become sanguine on the prospects for speculative-grade debt issuers (some might say complacent) as the brunt of QT begins to subside.
Lost in the current discussion about falling distressed debt levels is how tame the distress ratio was throughout the period of Fed monetary tightening, inflation spikes and heightened fears of recession. Since mid-2022 when inflation soared and aggressive QT began, the distress ratio never reached its long-term average, peaking at 9.2% in March 2023 despite widespread concerns of recession. Judging from the distress ratio, secondary leveraged credit markets mostly shrugged off such concerns even as new issuance volumes slumped and debt defaults and other restructuring events began to pile up in 2023. Contrast this with credit market reactions in 2015 and 2011, when the distress ratio rose sharply on growing concerns of recession that never materialized.
Consequently, the long-established positive correlation between the distress ratio and debt defaults has broken down in the last year. In fact, the relative gap between the distress ratio and default activity over the last 25 years has never been wider than it has been since 1Q23 (Figure 1). (Note: Quarterly default activity was used instead of the default rate, because the latter is measured on an LTM basis, which would distort the lead–lag nature of this relationship.)
It may be tempting to defer to the wisdom of markets and conclude that the low distress ratio currently indicates that credit markets aren’t fixated on recent default activity but are looking toward the end of the year and anticipating more benign business conditions and less restructuring activity ahead. Perhaps, but it’s also conceivable that the torrents of capital available in leveraged credit markets —much of it the indirect result of massive financial stimulus and monetary easing provided during the pandemic — have simply overwhelmed lenders and credit investors, mandating that they put money to work irrespective of the fraught business environment. How else can one explain that, despite still-challenging business conditions and a host of economic, political and geopolitical uncertainties playing out without clear resolution in sight, spreads for single-B rated corporate bonds have fallen by nearly one-half since mid-2022 (to 330 bps recently) and are approaching their lowest levels since 2006? Again, the word “complacency” comes to mind.
Restructuring stats for 1Q24 are not yet in the books but, to date, they give no indication of badly slumping activity levels. Chapter 11 filings for 1Q24 certainly will trail comparable filings for 1Q23, which were extremely elevated, but nonetheless will show robust filing activity following a slow start to the year. Fitch Ratings just reported the leveraged loan default rate continues to creep higher, hitting 3.7% in March, while S&P reported that the number of rated corporate debt defaults in the first two months of 2024 were the most since 2009 — propelling the U.S. speculative-grade default rate to 4.7%, its highest level since the unofficial end of the COVID-19 pandemic in mid-2021. None of this suggests that rampant restructuring activity lies ahead, nor does it give any support to the notion that halcyon days are awaiting.
Credit markets get it badly wrong sometimes, as they did in 2006-2007 when the distress ratio dipped below 1.0% just as the housing bubble was beginning to burst and within a year or so of the global financial crisis. At least then, corporate default activity was miniscule too, so the extreme optimism was understandable, to a degree. Today’s credit bulls have fewer reasons to be so optimistic about speculative-grade issuers, and an extra 300 bps of return seems meager compared to the downside risks, but that isn’t stopping them from charging ahead. After all, there’s money to be put to work — lots of it.
1: Bloomberg NBBDBAT and NBBDISST Indexes (March 2024).
Related Insights
Related Information
Published
April 04, 2024
 Key Contacts
Global Co-Leader of Corporate Finance & Restructuring