Linear Schedules
A Simple Visualization Tool for Complex Infrastructure Projects
-
June 29, 2023
Downloads Download Article
-

Massive investments are flowing into infrastructure projects worldwide. In the Kingdom of Saudi Arabia alone, over $1.3 trillion worth of projects are either planned or underway. Infrastructure projects, however, are becoming more complex with multiple stakeholders involved and myriad software technologies needed to manage design and execution. Here we will highlight the benefits of using linear schedules to better visualize, communicate, and evaluate the sequence of linear infrastructure projects.
Introduction
The construction schedule is an essential tool for planning, managing, and monitoring the progress of infrastructure projects. There are different types and varieties of construction scheduling software used in the construction industry. The tools vary depending on how they represent and analyse activities and their logical relationships.
The most commonly used scheduling software in the construction industry are Oracle Primavera P6 and Microsoft Project. Both utilize the critical path method (CPM) to schedule activities; and then represent the schedule in a Gantt chart format. They are pervasive in the industry due to their ease of use and analytical capabilities but, to some degree, they are also used because the capabilities and functionality of other specialised tools, such as Linear Scheduling, are not recognized.1
While Oracle Primavera P6 and Microsoft Project are powerful tools that include essential functions needed for scheduling and project control, visualizing the schedule using these tools is limited. A time-scaled bar chart may not be ideal for most linear infrastructure projects, such as railroads, because such representation is incapable of displaying the location and progress rate of different trades.
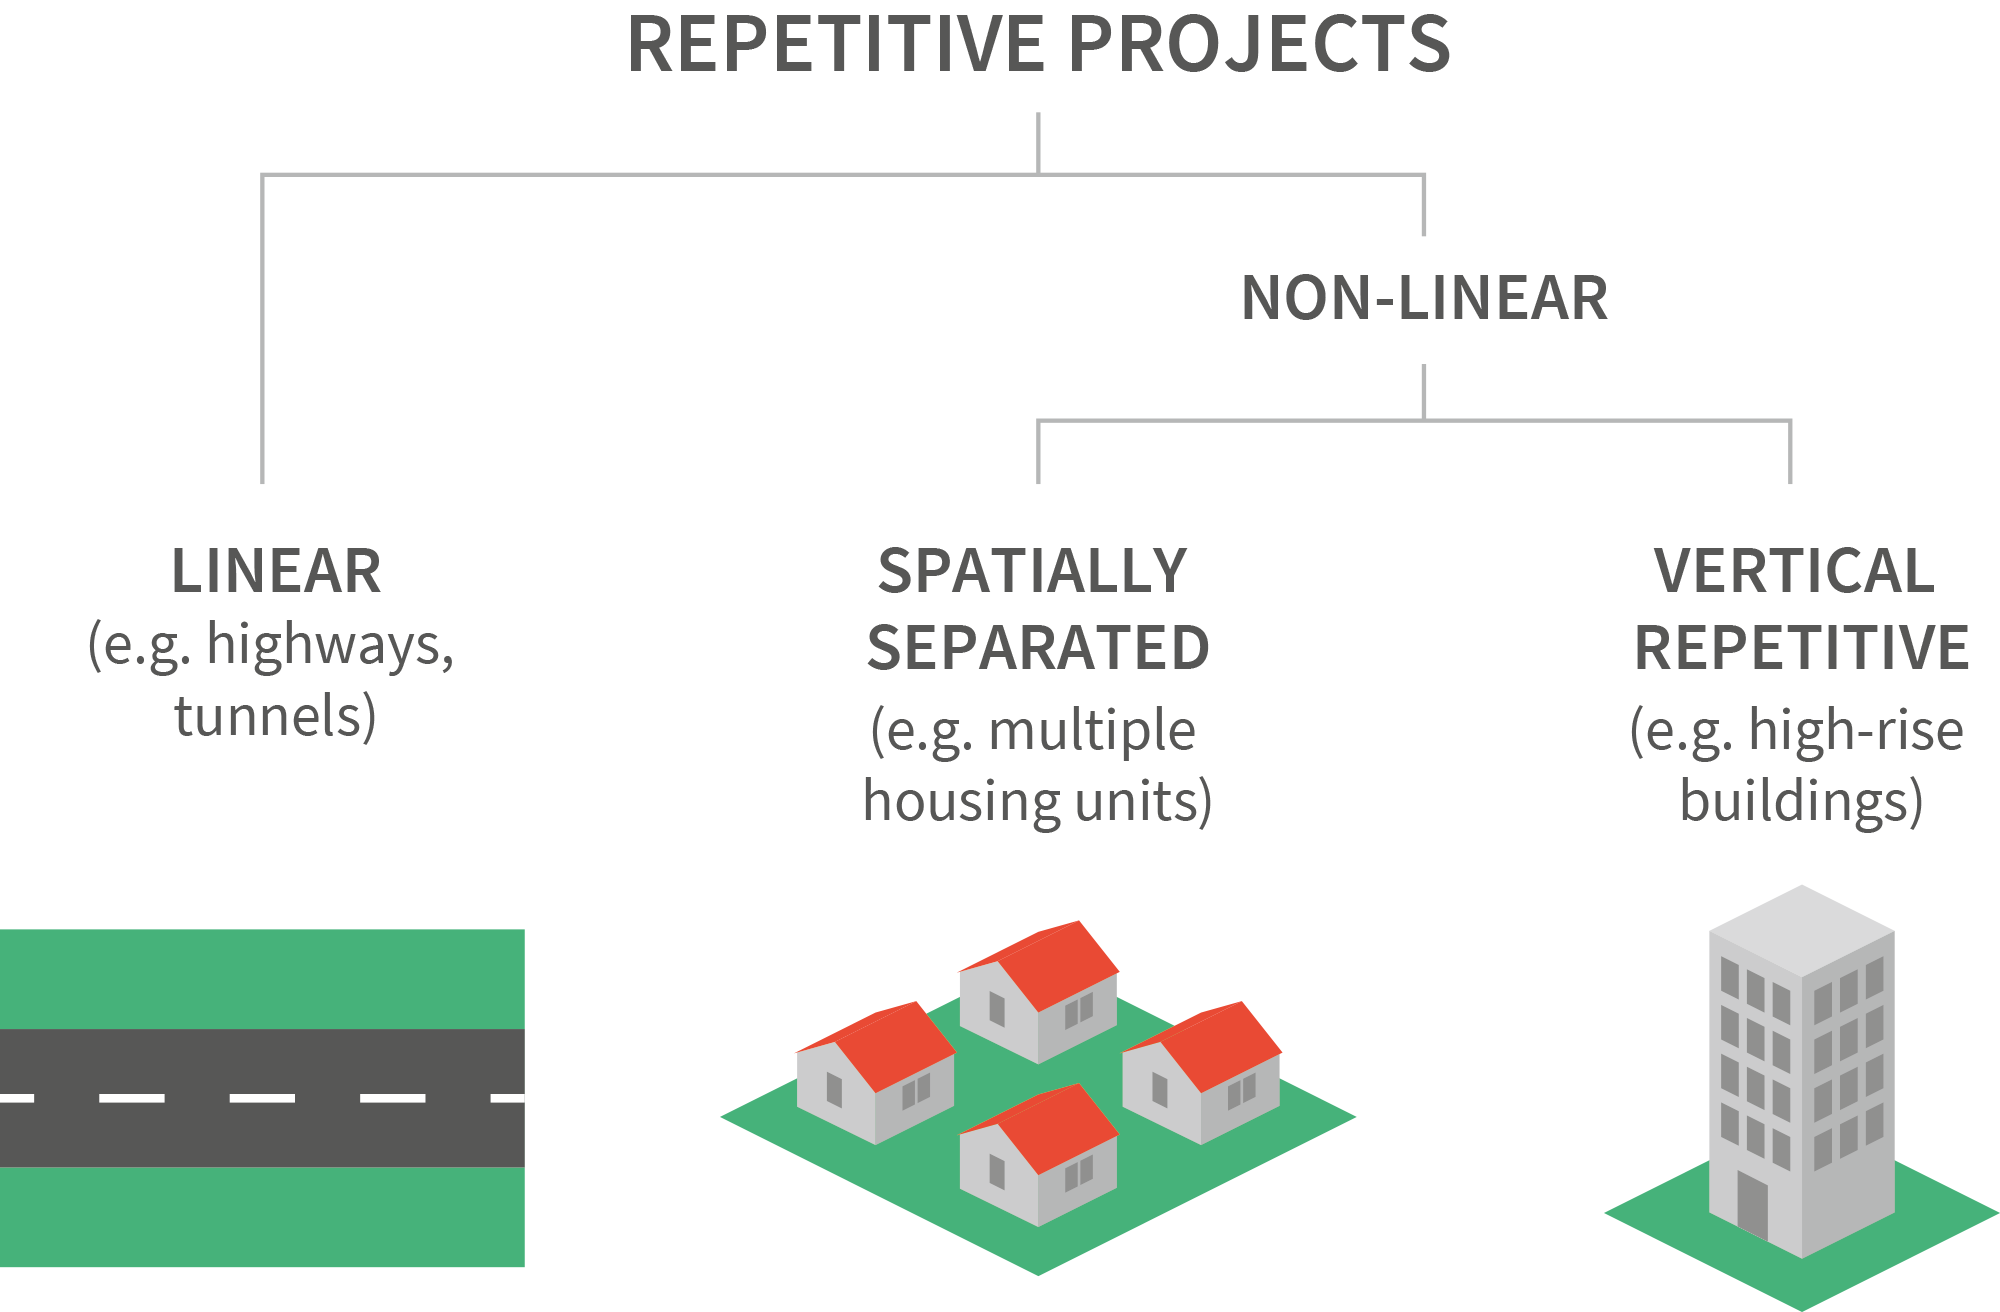
Repetitive Construction Projects
Many construction projects include several repetitive units (e.g., floors, road sections, multiple housing units) and can generally be categorized as either non-linear or linear, as shown in Figure 1. Non-linear repetitive projects include high-rise buildings and projects with scattered units such as housing projects, while linear projects are characterised by a horizontal geometric layout such as in pipelines, railroad, and highway construction projects.
Figure 1 – Types of Repetitive Construction Projects
Linear schedules show large amounts of data related to repetitive activities, resources and productivity rates along the path of construction making them more practical in these instances. The most significant advantage being the detail and visualisation of progress being communicated in a simple, graphical fashion.
Just what is Linear Scheduling?
Linear scheduling is a graphical technique that is concerned with movement of resources through locations on production tasks. These graphical techniques were used as a construction management system as early as 1929 on innovative projects such as the Empire State Building. It was further developed by the Goodyear Company in the 1940s and expanded by the US Navy in the 1950s.2
Figure 2 – Time-Location Axes in a Linear Schedule
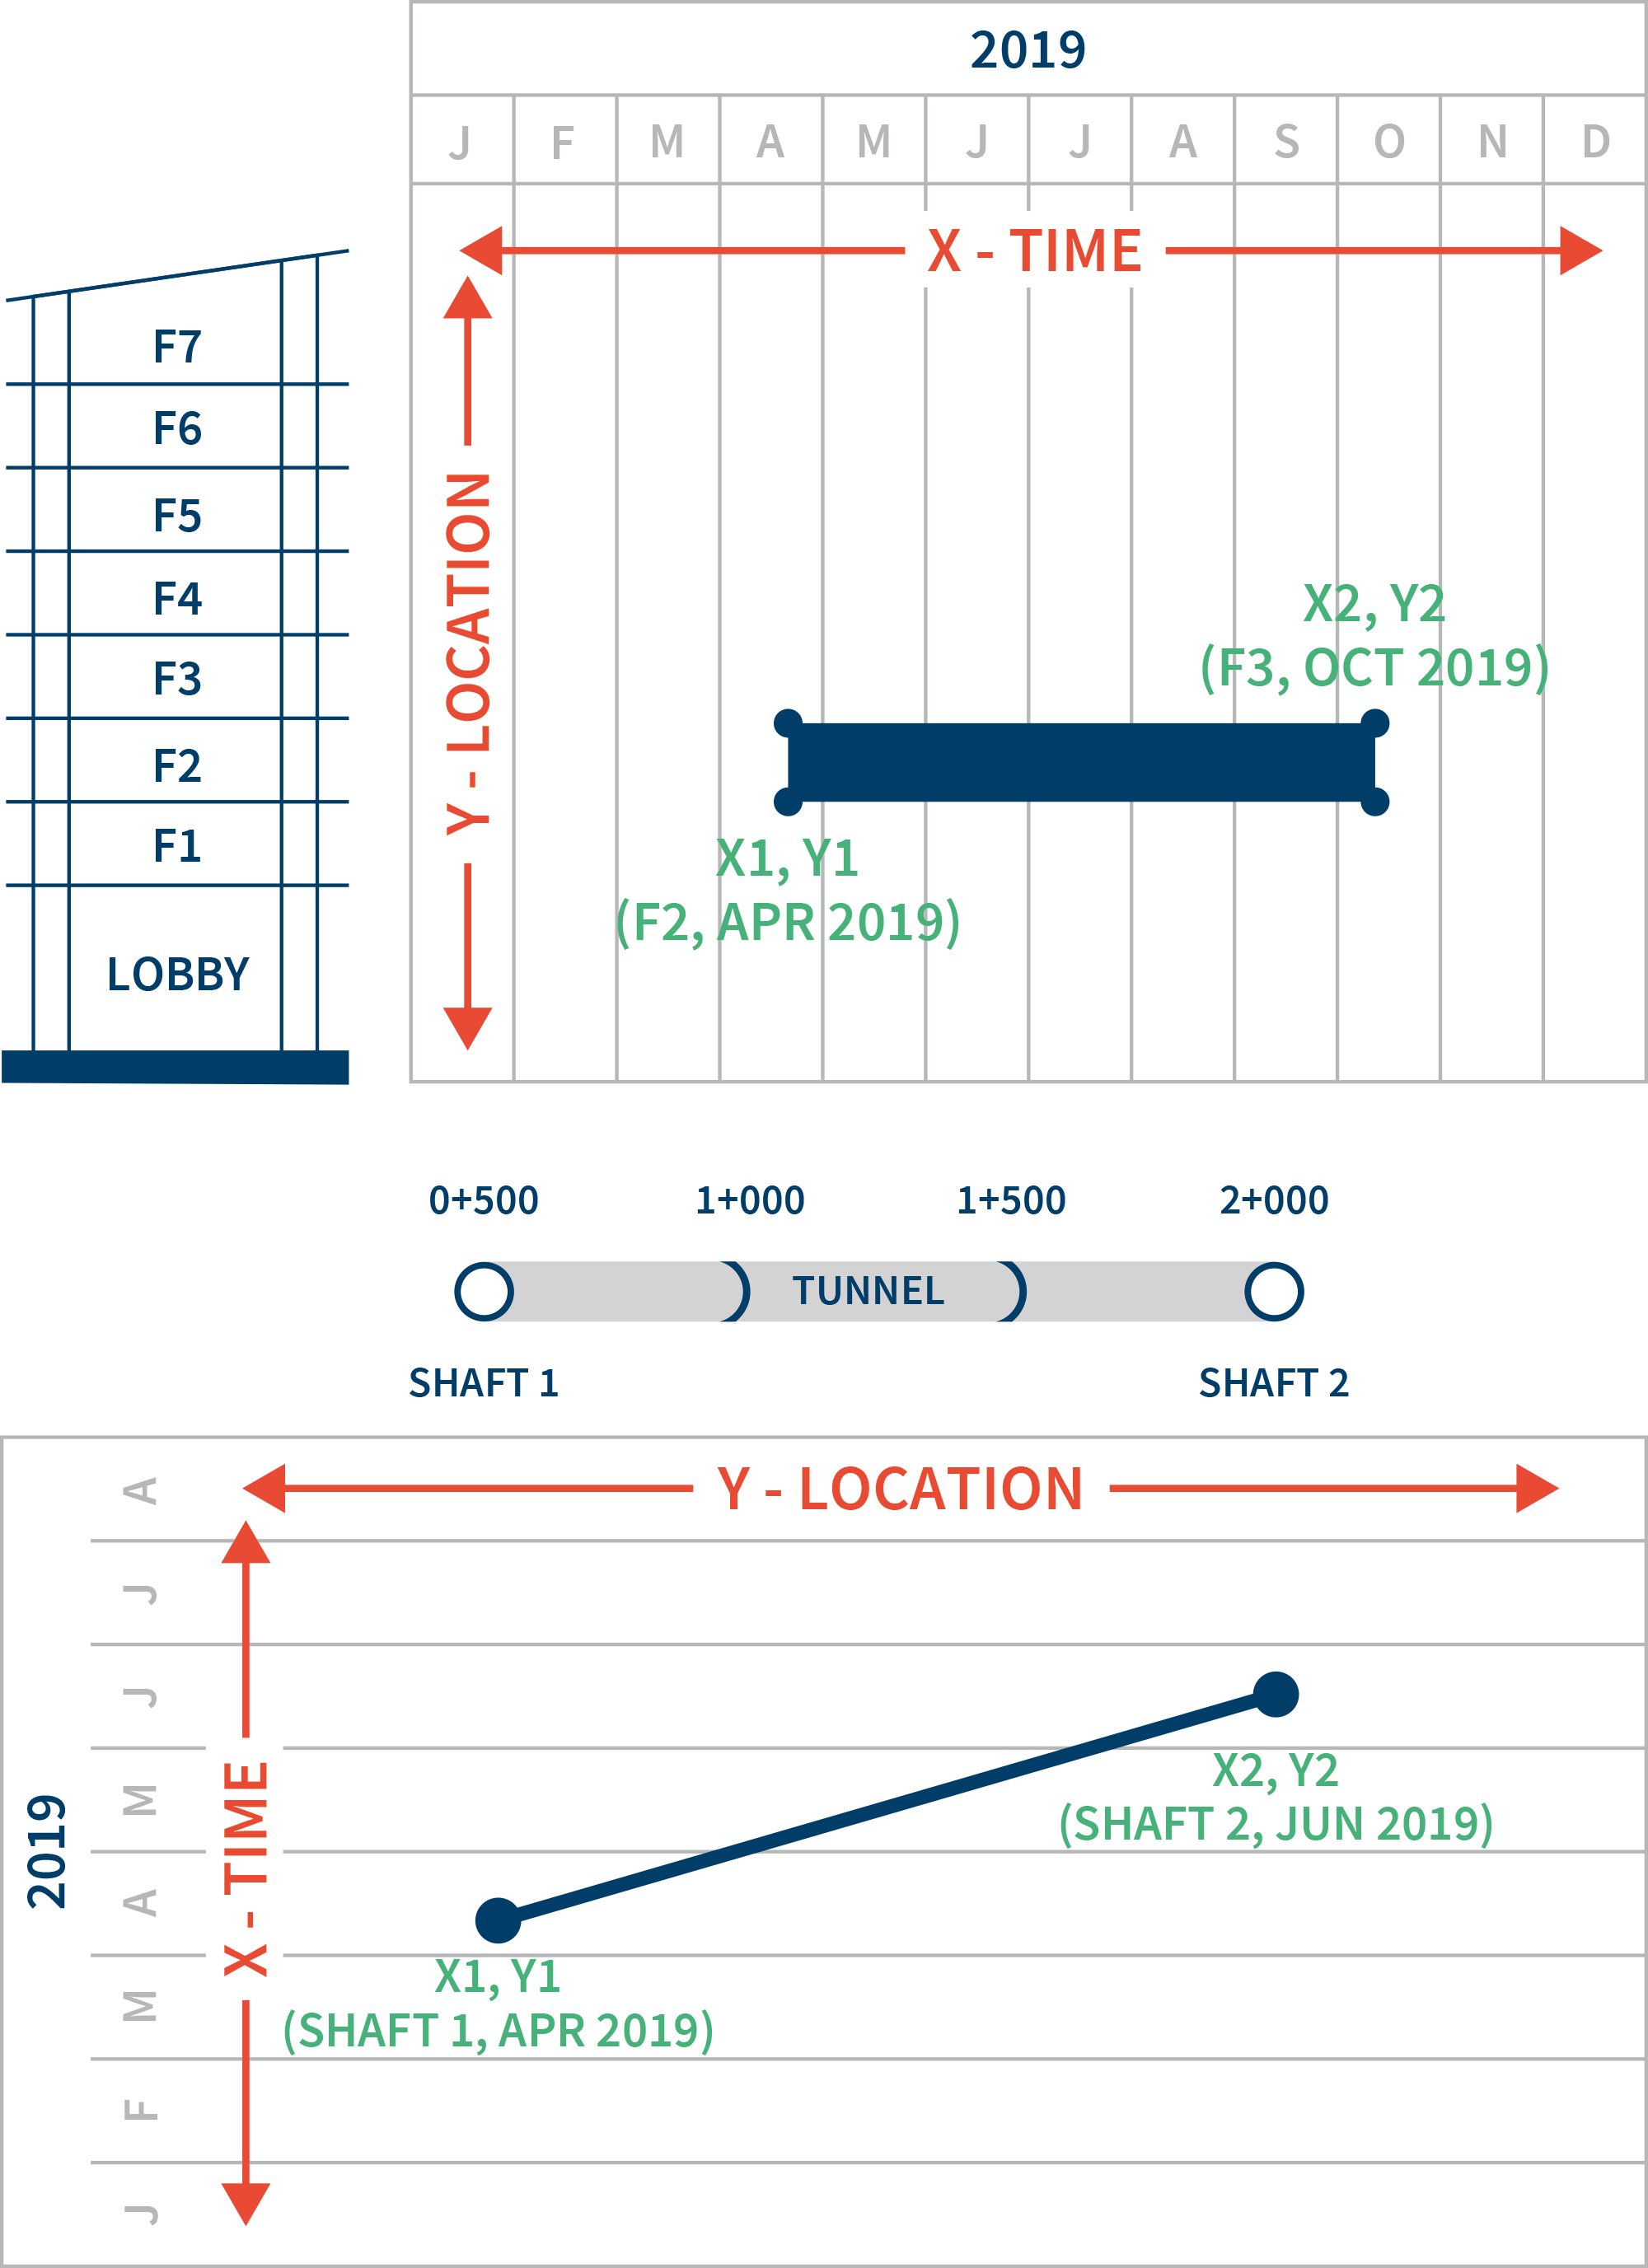
The linear schedule depicts both time and location on the same chart. As shown in Figure 2, a linear schedule generally has two axes and, depending on the type of project, they can change:
- Time on the “Y” axis and location on the “X” axis. Best for linear projects such as highways and pipelines.
- Time on the “X” axis and location on the “Y” axis. Best used for high rise buildings and construction of multiple units in different locations.
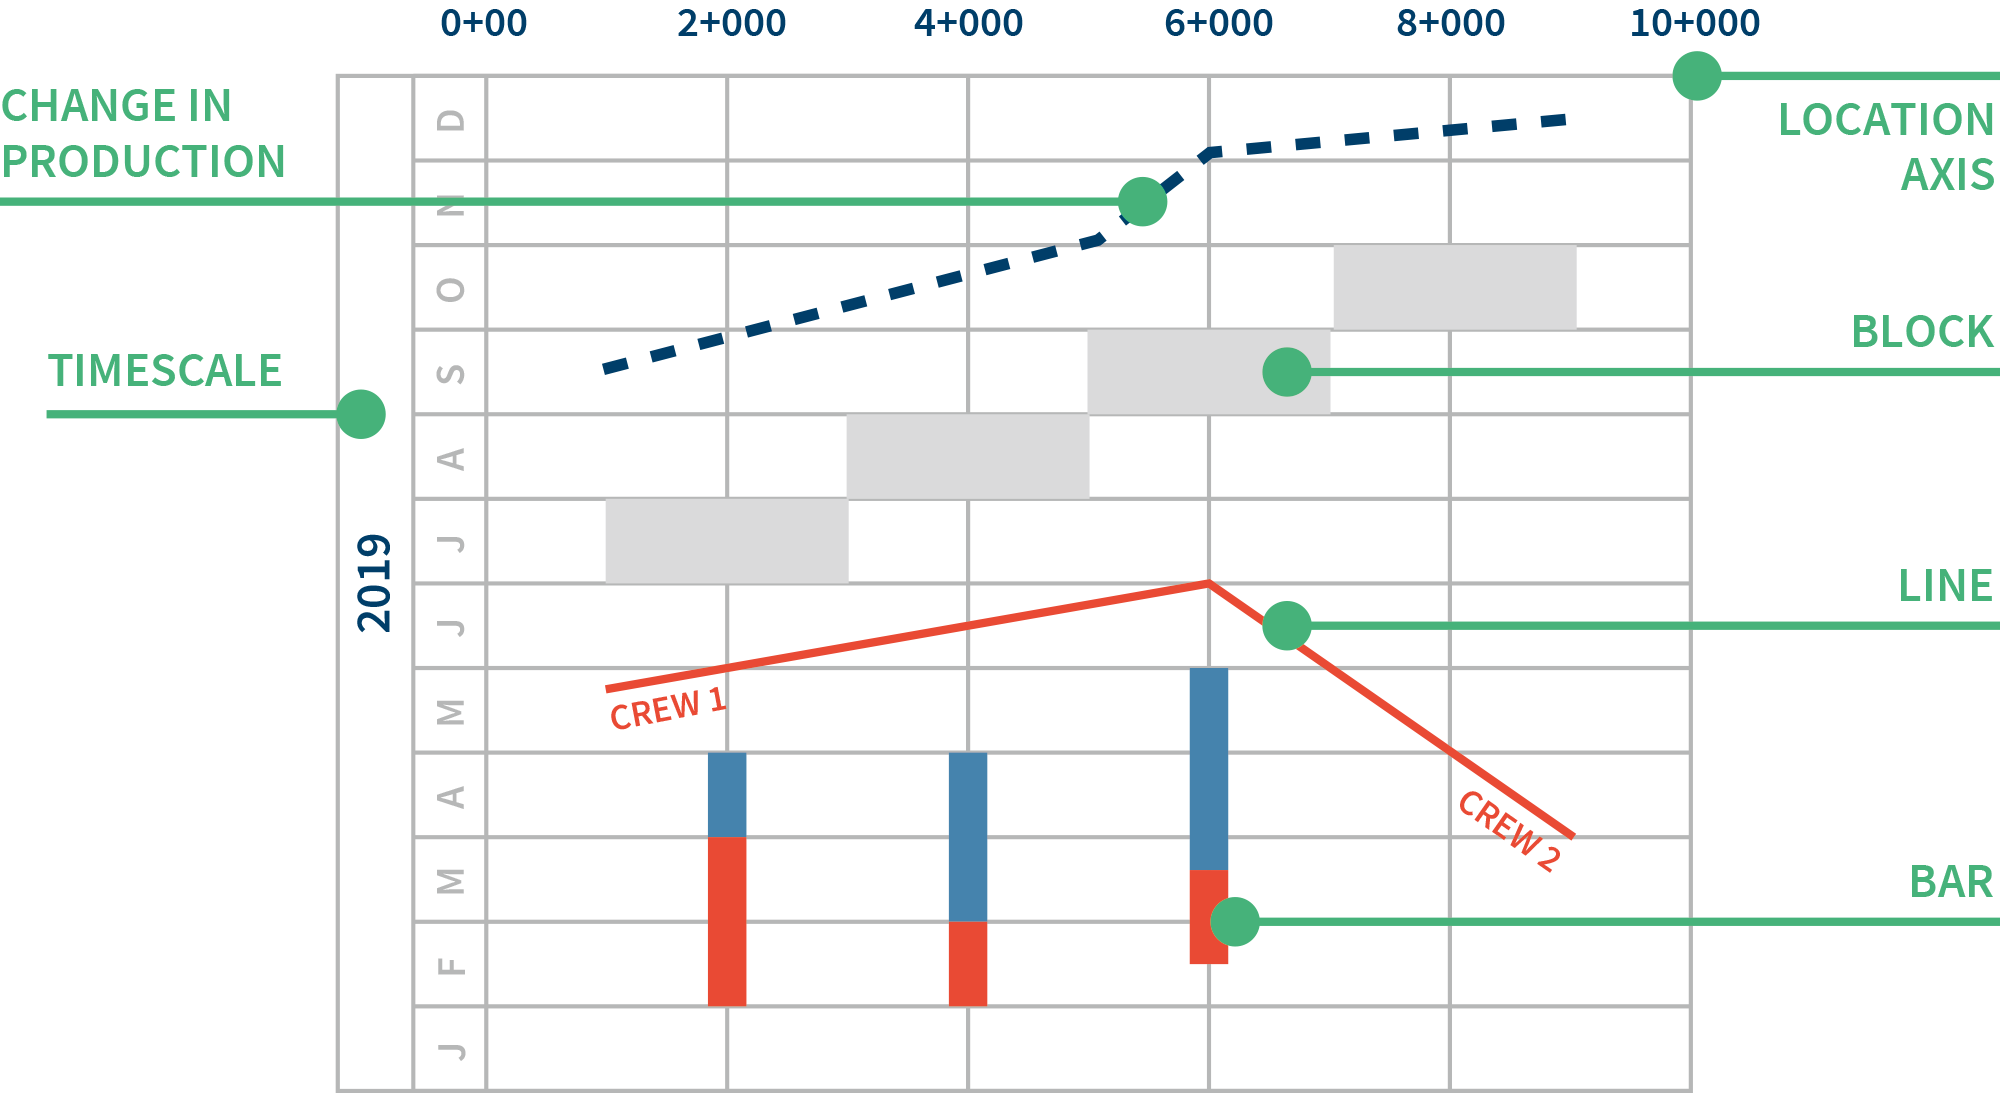
Figure 3 shows a typical representation of a linear schedule with linear activities as lines with patterns for identifying different activities or crews. Different activities can be represented in a linear schedule as follows:
LinesActivities that start in one location and finish in another over a period of time. The slope of the line can be used to calculate the production rate (quantity per time). Example - paving a road in a highway project.
BarsRepresent activities that take place at one location over a period of time. These bars can be used to identify when a crew will occupy a specific location and whether it will interfere with other linear operations. Example – the construction of a shaft in a tunnelling project.
BlocksRepresent activities that take place over a given space for a defined time. A block can also be used to illustrate project constraints such as weather or areas of the project that have restricted access during a certain period. An example of such an activity is hydro testing in a pipeline project.
Figure 3 – Types of Activities in a Linear Schedule
How to Prepare a Linear Schedule?
A linear schedule must include the following information for each activity:
- Start Date
- Finish Date
- Start Location
- Finish Location
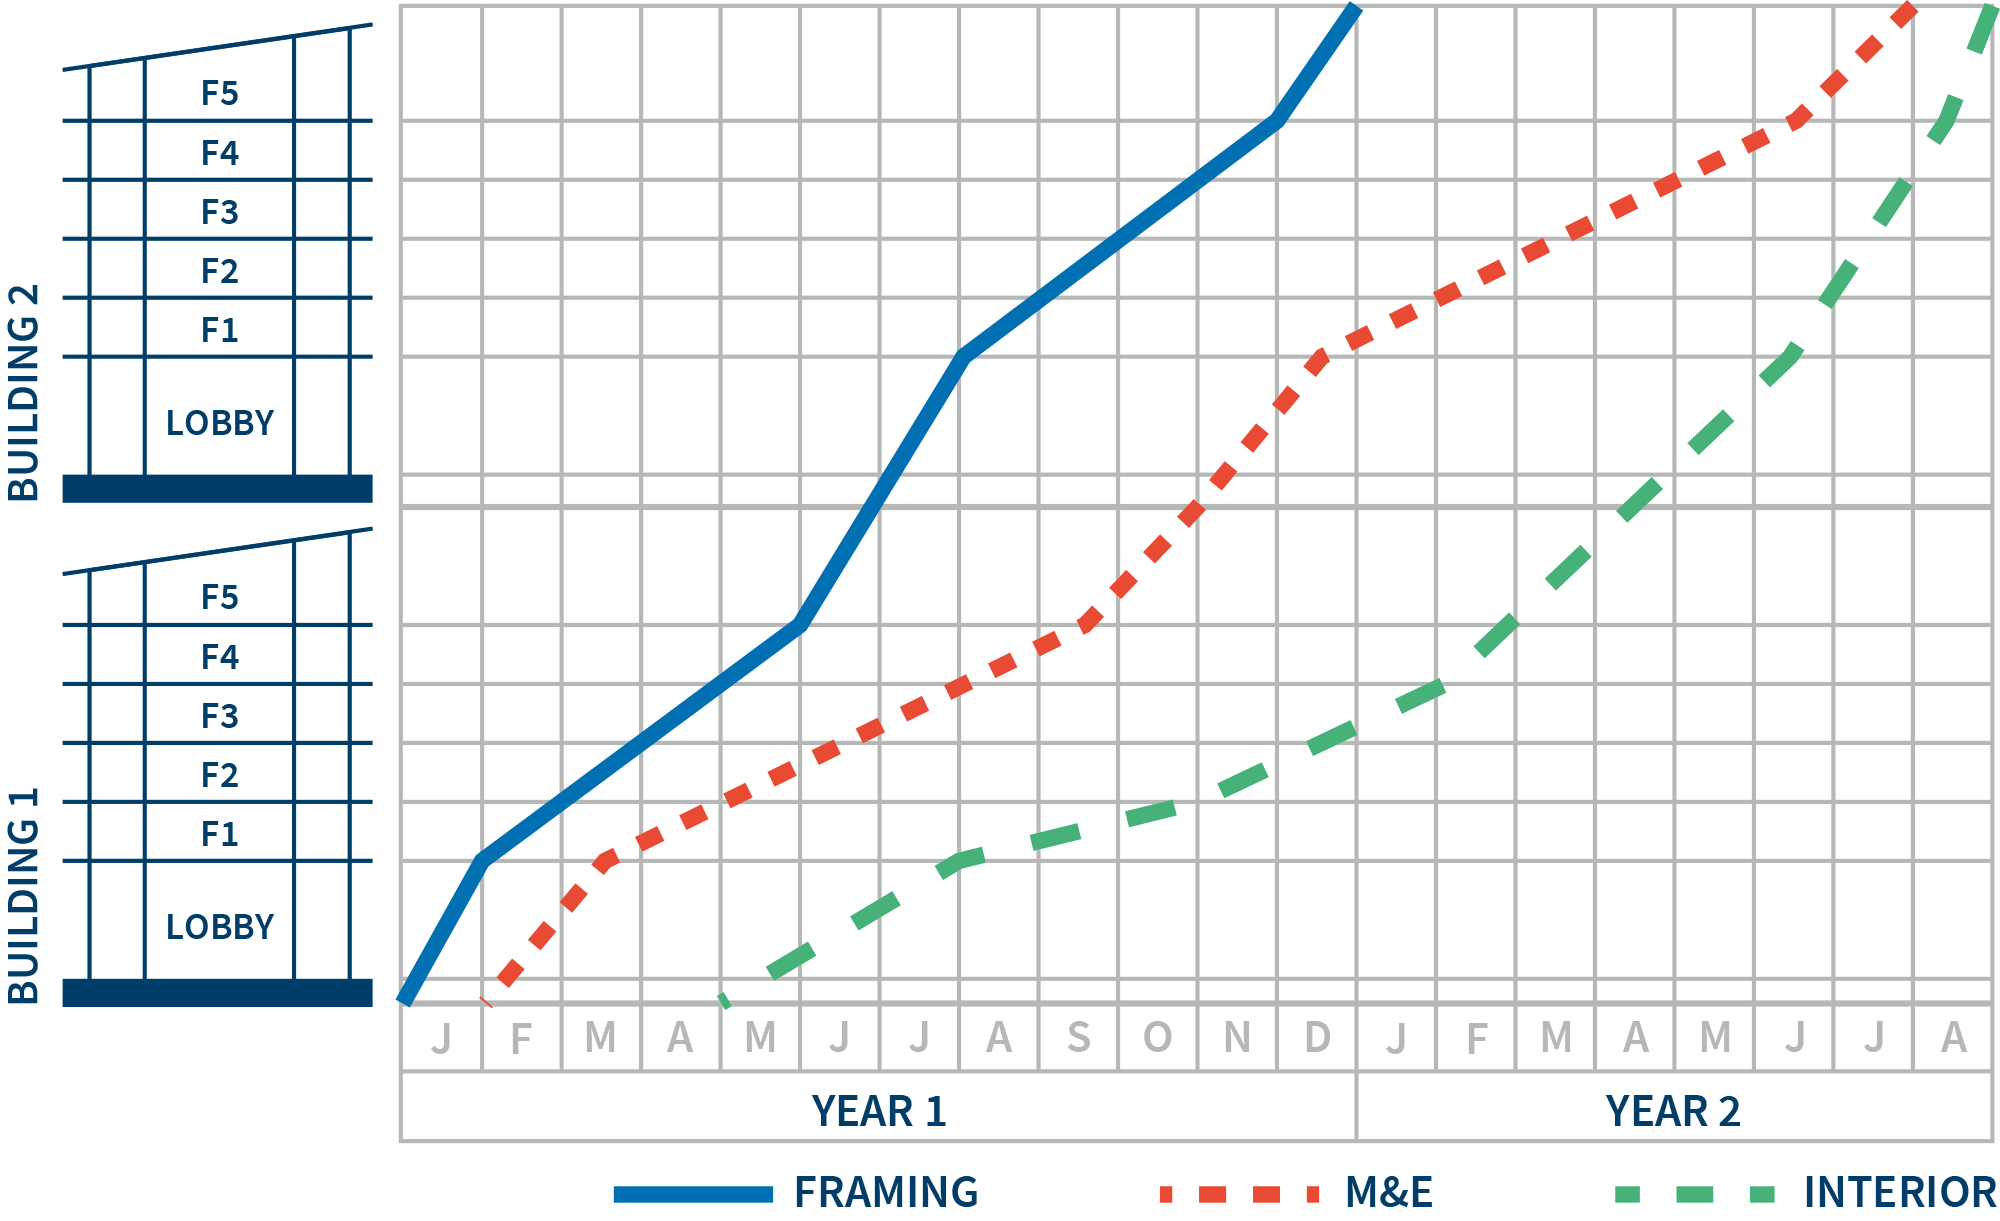
Start and finish dates can be extracted from the CPM schedule, while the start and finish locations or distances can be identified using the drawings or construction plans. Once these are identified for each activity, it is recommended to create a “Task Template” for each operation or type of work. For example, Figure 4 shows framing work as solid blue lines, mechanical and electrical work as dotted orange lines, and interior work as dashed green lines.
Benefits of Linear schedules for Owners and Contractors
Better VisualizationLinear schedules provide a better visualization of the project schedule by displaying the location and rate of progress over time per trade. As shown in Figures 2 and 4, additional graphs can be added to enhance ease of interpretation and to visualize the location of activities. Other examples of additional information include inserting the project’s plan or ground profile either below or above the X-axis. A histogram of resource requirements can also be added to the side of the Y-axis.
Schedules developed and analysed using Primavera P6 or MS Project can be charted in the form of a linear schedule to better convey the results of the analysis.3 In other words, a linear schedule can be created from the information available in the P6 or MS Project data.
Figure 4 – Example of a Linear Schedule for Multiple Buildings
Validation of Baseline Schedules
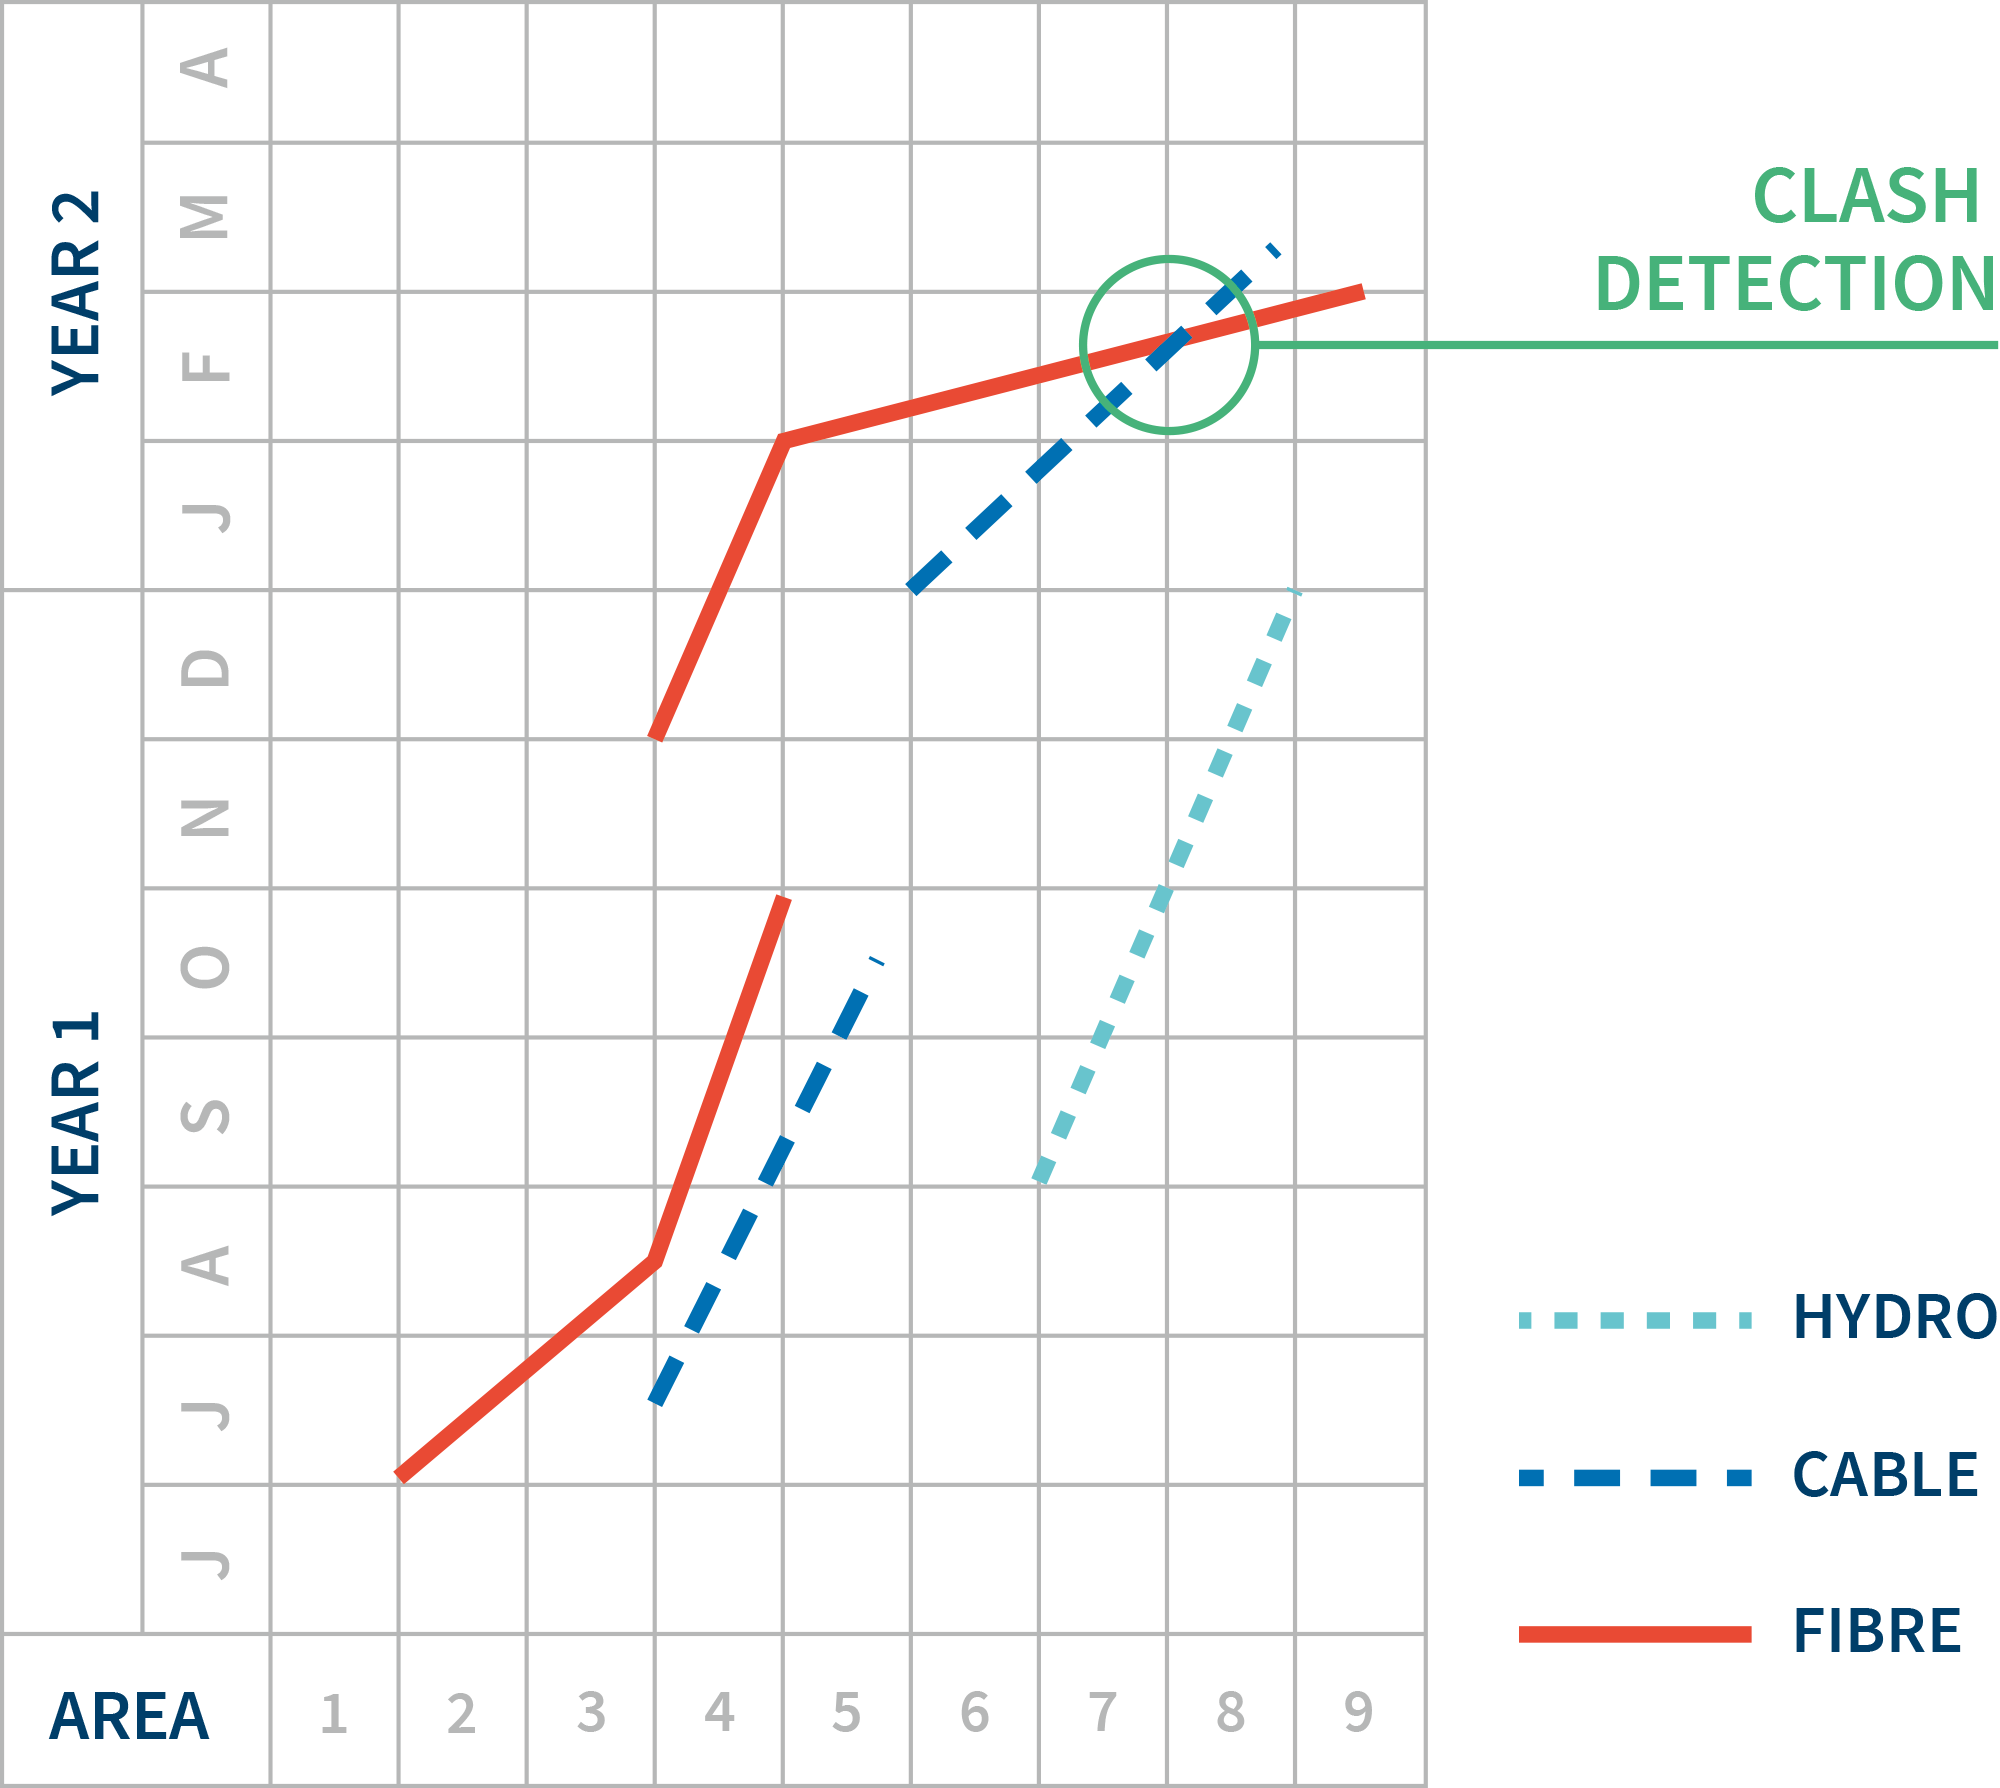
Linear schedules help the project team in identifying schedule errors that cannot be easily identified in the time-scaled bar charts. Figure 5 shows an example of a linear schedule of utilities relocation work. The intersecting lines indicate that at that point in time, two trades are scheduled to be working in the same location at the same time. Therefore, the schedule not only tracks the project in time, it also ensures that there are no conflicts between crews on site.
Figure 5 – Example of a Linear Schedule for Utility Relocations Work
Evaluation of Actual Progress and Schedule Delays
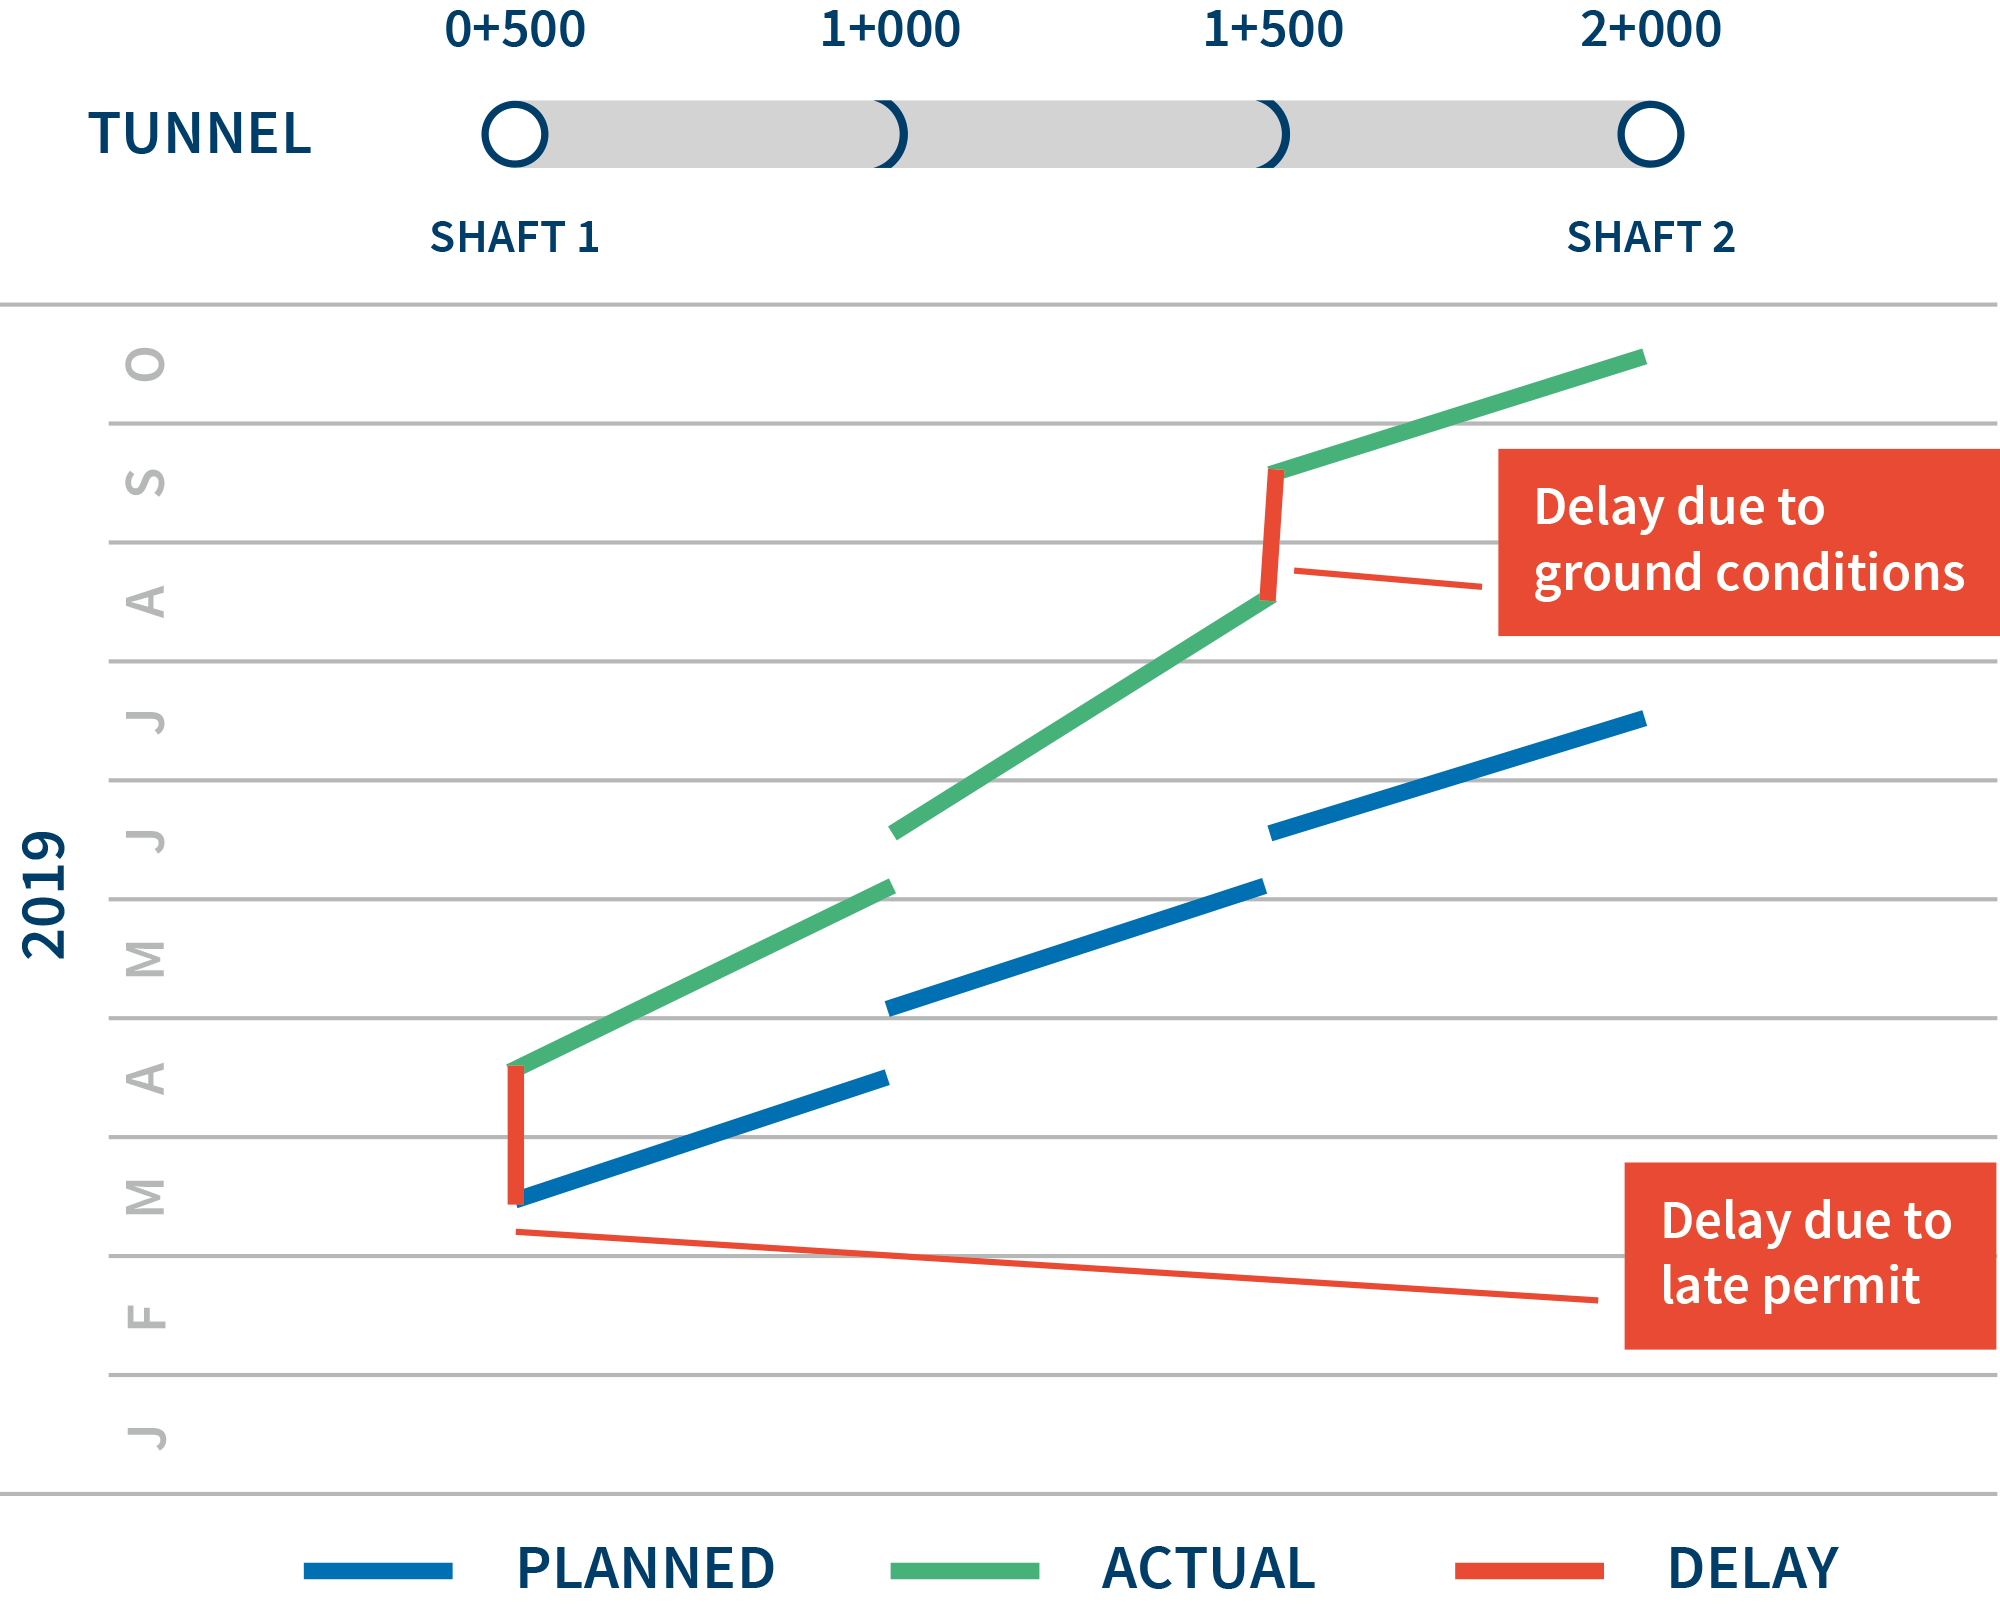
Communicating the schedule analysis of a complex construction project in a simple and understandable format is a key factor for a successful claim presentation. Linear schedules can provide enough flexibility to simplify the delay analyses of a construction project and can be updated and interpreted quickly.4
Deviations from the planned progress are identified through changes in the slopes of the lines representing activities, which indicate changes in productivity. Furthermore, activities can be represented as various shapes and differentiated by colours, or patterns, which make the schedule easy to understand. Figure 6 shows an example of plotting the planned progress (blue lines) versus the actual progress on site (green lines).
Figure 6 – Planned vs. Actual for Tunnelling Activities
Conclusions
Linear Schedules are great communication tools for explaining how events evolved in a complex construction project; in a way that can be easily understood by those not familiar with the details of construction operations. Some project owners even included the use of linear schedules as part of the contract specifications. Here is a recent extract of a schedule specification:
There are few commercial software tools for developing linear schedules, including GraphicSchedule, TurboChart, and Tilos Software. It is recommended to use a CPM scheduling software for developing, resource loading and tracking the progress of construction schedules. A linear schedule can then be generated using the activities start and finish dates calculated by the CPM schedule to provide a better visualization of the construction schedule.
Wail Menesi, Ph.D.
Dr. Wail Menesi is a Senior Director at FTI Consulting based in Abu Dhabi, United Arab Emirates. His professional practice focuses on schedule analysis in support of construction claims and expert evidence,as well as providing advisory services related to ongoing construction projects.
He has been appointed as a scheduling expert witness and has acted as assistant expert witness on delay matters.
Footnotes:
1: MEED Projects Report “Saudi Arabia Projects H2 2022”, dated 15 September 2022.
2: Yamin, R. A., & Harmelink, D. J. (2001). Comparison of linear scheduling model (LSM) and critical path method (CPM). Journal of Construction Engineering and Management, 127(5), 374-381.
3: Kenley, R., & Seppänen, O. (2009, December). Location-based management of construction projects: Part of a new typology for project scheduling methodologies. In Winter Simulation Conference (pp. 2563-2570).
4: Tapia, P., Ricardo, M., & Gransberg, D. D. (2016). Forensic Linear Scheduling for Delay Claim Analysis: Panama Canal Borinquen Dam 1E Case Study, 2016 Transportation Research Board Annual Meeting Compendium of Papers, Paper 16-0557, National Academies, January 2016, Session 492, 15pp.
5: California High-Speed Rail Authority General Provisions. Available from https://hsr.ca.gov/wp-content/uploads/docs/programs/track/Part_A-2_TS-1_Industry_Draft_General_Provisions.pdf, date accessed: 22-January 2023.
Related Insights
Published
June 29, 2023
 Key Contacts
Senior Director