
-
novembre 13, 2019
-

A well-defined FP&A technology infrastructure is key to improving business performance.
The impact of technology on business operations in the 21st century cannot be overstated. In the past few decades, new tools have transformed sales, customer service, supply chains, manufacturing, HR and finance by providing greater transparency within each function.
However, we have yet to fulfill the promise to identify trends derived from oceans of data and dynamically adapt to them. Financial planning and analysis (FP&A) can fill the gap. By utilizing a well-defined FP&A technology infrastructure, you can unlock timely and accurate insights to measure and improve business performance.
Key Pillars of the Infrastructure
FP&A technology infrastructure enables an organization to utilize the data generated from business operations for reporting, planning and analysis. Key pillars of the infrastructure include design and metadata management, operating tools, financial tools and data analytics/visualization tools. Here’s a look at each pillar.
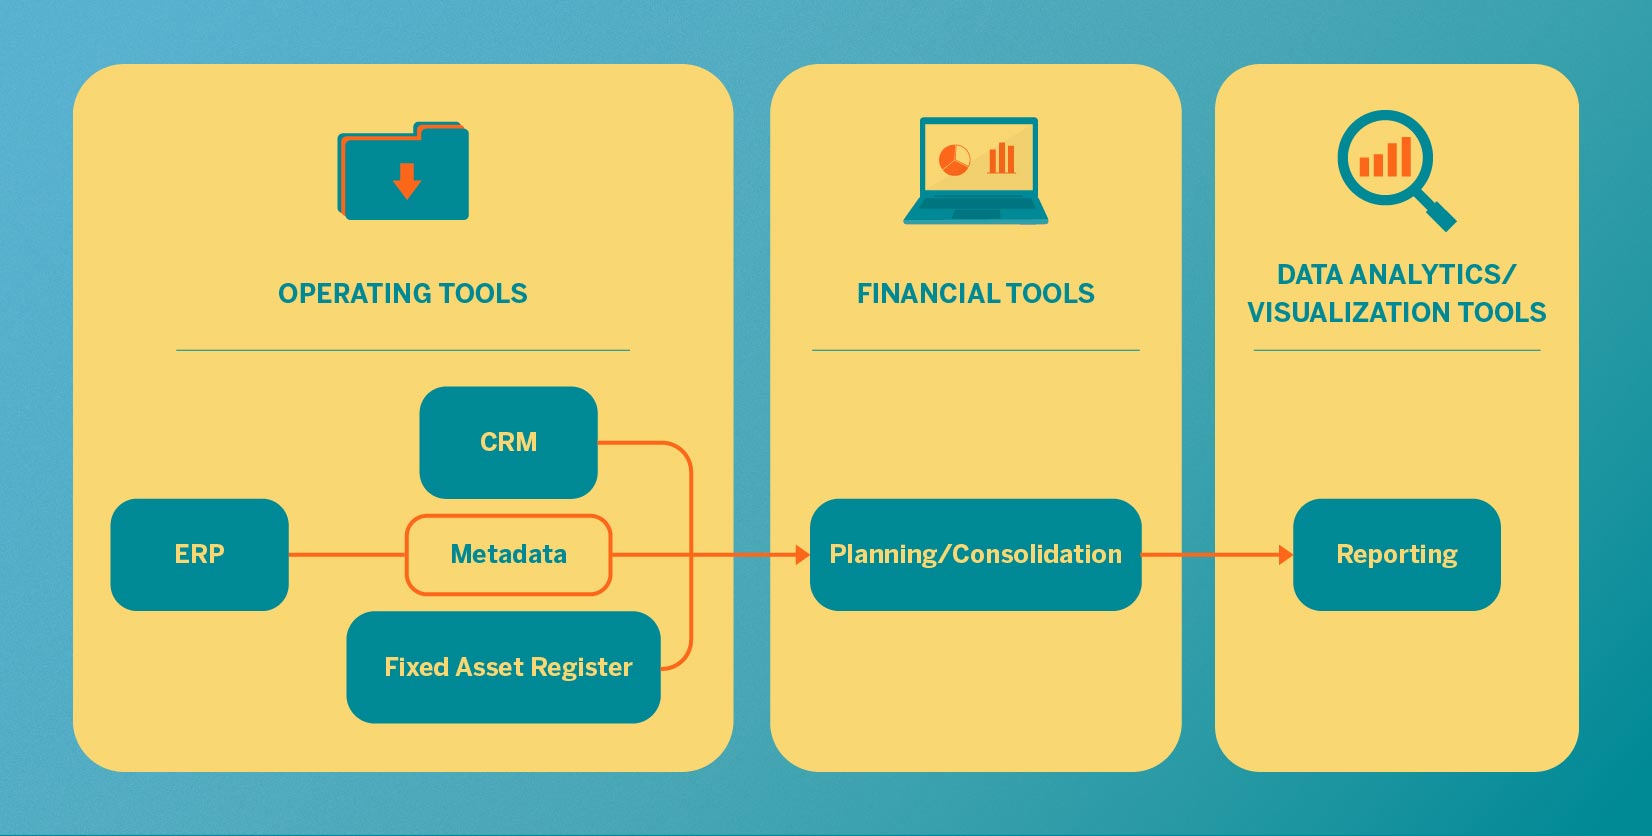
(Tools depicted are representative of each category, but not a definitive list.)
The modern business can generate terabytes of data every hour. The ability to translate data (or metadata, as it’s often referred to when collected for sharing across your ecosystem) into information that can be used to effect business decisions depends on the structure that it is funneled through. As an FP&A professional, it’s vital to be able to align entities, cost centers and accounts to operations and owners.
Operating ToolsOperational transactions that generate revenues or expenses make up the foundation of an organization’s information technology. “Operating tools” are the systems that employees interact with throughout the process of selling, producing, rendering and delivering the organization’s goods or services.
In the most mature state, these tools are built on a single organization-wide platform that aggregates all operating activity across functions; however, this isn’t necessarily the right solution for everyone.
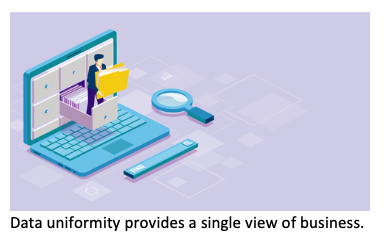
Key considerations for operating tools should be ease of capture (how difficult it is to get data into the system), ease of use (how difficult it is to operate within the system) and data uniformity (how much data can be used for comparison across the organization). Data uniformity is crucial if you want to have a single view of the business, and there are ways to transform data on common parameters to garner insights from a mosaic of operating tools.
Financial ToolsFinancial tools lay on top of the data generated by operating tools to consolidate, report and plan financial statements. Their ability to provide insights, as well as report and plan business performance effectively, is predicated on extracting quality data. Depending on the size and scale of operations, consolidation of a single set of books can require more complex procedures, like intercompany profit eliminations or statutory reporting hierarchies.
At the top of the technology stack lies the data analytics/visualization tools. Offerings in this space can aggregate the financial and operating data. Further, they can incorporate external data points and create intuitive dashboards that allow for management to interact with data and validate assumptions in real time to inform business decisions.
Data Integration ToolsData integration tools extract data from both operating and financial tools, transform and merge data from various sources, and load it into a repository that is available for reporting and analysis. The tools enable timely access to data with minimal manual intervention and help maintain data integrity.
The Infrastructure in Action
Putting it all together, here’s how the elements work in concert within the FP&A technology infrastructure.
Design and Structure of Business MetadataBusiness metadata design lays the foundation for the entire technology stack. Design elements are categorized as either dimensions or attributes. Dimensions are hierarchies unto themselves; examples would be entities or accounts. Attributes are descriptors; they can be project codes or base/variable cost indicators.
If you think about a single transaction, dimensions would be the key pieces of information that you would need to organize the information, such as an entity or account; an attribute, on the other hand, could tell you whether the transaction was aligned to a special project or geography. Entity structures should be aligned to the operations of the company. In a healthy technology infrastructure, the entity hierarchy should reflect the organization of business units in the company, the chart of accounts should be uniformly accepted across the organization, and there should be a standard usage definition for all attributes.
Integrated Operational and Financial ToolsIntegrating financial and operational data creates value for the business by establishing the link between finance and operations. This requires defining KPIs and leveraging both financial and operational data — as well as visualization tools — to develop a scorecard to monitor and report. The output helps align operational drivers to financial performance and drive accountability and cross-functional dependencies.
Enabling Self-Service Business IntelligenceThe data visualization tools enable self-service business intelligence and provide timely and accurate access to data. This empowers business users to integrate data into decisions while creating a culture of evidence-based decision-making.
Controls and SecurityEstablishing meaningful controls and security is essential to maintaining credible data and providing an efficient user experience. In an ideal state, employee access is organized into user groups, with “write” enabled so they can access areas they own, “read” enabled for areas they require only for context, and “restricted” enabled for data they don’t need.
Finding the Right Fit for Your Organization
Technology should not dictate the insights the FP&A team are enabled to deliver; leveraging platforms that enable flexibility and scalability in reporting is far more crucial. “Best-in-class” technology and tools are those that fit your organization’s needs. You can evaluate fit using the following guiding questions:
- Does my current technology infrastructure enable me to understand the operational drivers of my business and hold my operating teams accountable?
- Is my business metadata aligned with current business activities and provides? Should I redesign by metadata to drive relevant business insights?
- Am I able to use the technology platform I have for all planning and reporting requirements? Am I asking for ad hoc reports?
- What’s my technology plan in the medium to long term? Where can I make investments that will give my business the best return?
While the needs of every company are not the same, a considered and reasoned approach to identifying options for potential tools, as well as gaps in existing infrastructure, can ensure that FP&A is positioned to operate as efficiently and effectively as possible for your company.
© Copyright 2019. The views expressed herein are those of the authors and do not necessarily represent the views of FTI Consulting, Inc. or its other professionals.
About The Journal
The FTI Journal publication offers deep and engaging insights to contextualize the issues that matter, and explores topics that will impact the risks your business faces and its reputation.
Date
novembre 13, 2019